Report Tab
The Report tab provides charts and statistics about events associated with the list including subscribes, unsubscribes, and campaigns sent.
Subscribes include all new subscriptions from Import, API commands, Subscription Forms, Preference Sites, and any new subscription added by an Admin.
Unsubscribes are totaled from based on Contact initiated events. This may include Unsubscribes from a campaign, Unsubscribe Form, Preference Sites, and API commands.
Accessing the List Overview
To view the List Overview, go to LISTS > LISTS and then click the List to view. Click the REPORT tab to view the details. The List Report tab is made up of the following sections:
- Filter
- Subscriptions Summary Line Graph
- Subscriptions Totals
- Subscribes Graph
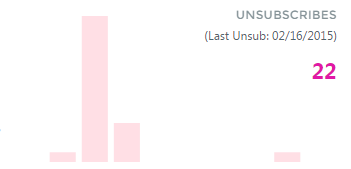
- Unsubscribes Graph
- Campaigns
Filter
The Filter allows you to set a date range for which to report data related to the list. On page load, the date range indicates the week prior to today. No data is available for the current day as it is summarized at the end of each day.

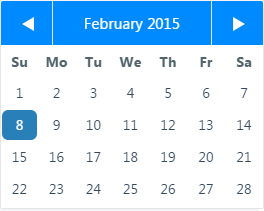
To change the Date Range, click in a Date field, then either type a date in mm/dd/yyyy format, or click a date in the Date Selector calendar. Once you have set the Start and End date, click GO to refresh the Report tab results.
Subscriptions Summary Line Graph
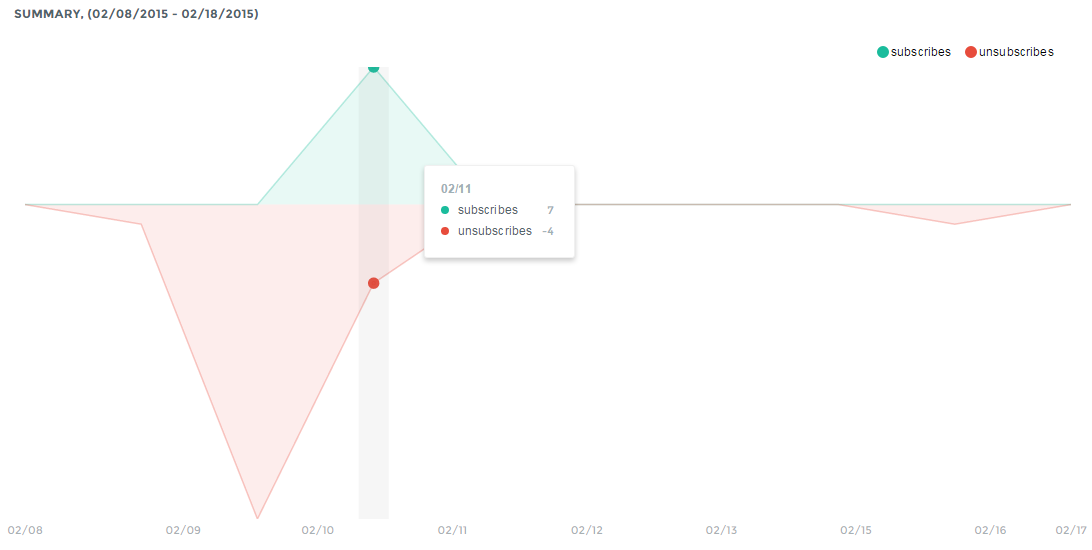
The Summary Line Graph displays counts of all Subscribes and Unsubscribes per day in the Date Range defined. Subscribes appear in green and Unsubscribes appear in red. To see the totals for a specific day, mouse over the chart and a popup for that date will display.
Subscriptions Totals
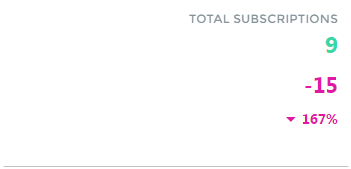
The Subscriptions totals box gives a quick overview of the total number of subscriptions and the change during the Date Range. The number of current Subscriptions is totaled in green. Unsubscribes for the Date Range are totaled in red. The percentage change in subscriptions is displayed in red or green depending on how the total changed over the Date Range.
Subscribes Graph
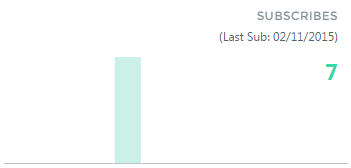
The Subscribes bar graph shows the number of subscribes per day for the Date Range, the total number of subscribes for the period, and the date the last subscription was created.
Unsubscribes Graph
The Unsubscribes bar graph shows the number of unsubscribe events per day for the Date Range, the total number of unsubscribe events for the period, and the date the last subscription was removed.
Campaigns List
The Campaigns List displays all campaigns published within the Date Range for the List. Each Campaign is listed in order of Campaign ID and includes the Campaign Name (if it is defined), the Template deployed, the Campaign Sent date, and the date the Campaign Ended.

*Added in v11.5.0